A common assumption in most resting state fMRI (rsfMRI) studies is temporal stationarity. However, recent work has shown that rsfMRI connectivity patterns change considerably across short periods of time, even within the length of a typical rest scan. Little is known about this phenomenon (see Hutchinson et al. 2013 for an in-depth review of this topic). For example, we don't know yet what is the most appropriate temporal scale to investigate this phenomenon. We also don't know if all connections have similar or different levels of variability. Moreover, the potential relationship between fMRI connectivity changes and ongoing cognition is not yet fully understood. Several projects at the SFIM focus on characterizing and understanding BOLD connectivity dynamics both during undirected rest and task.
1. Periodic Changes in fMRI Connectivity

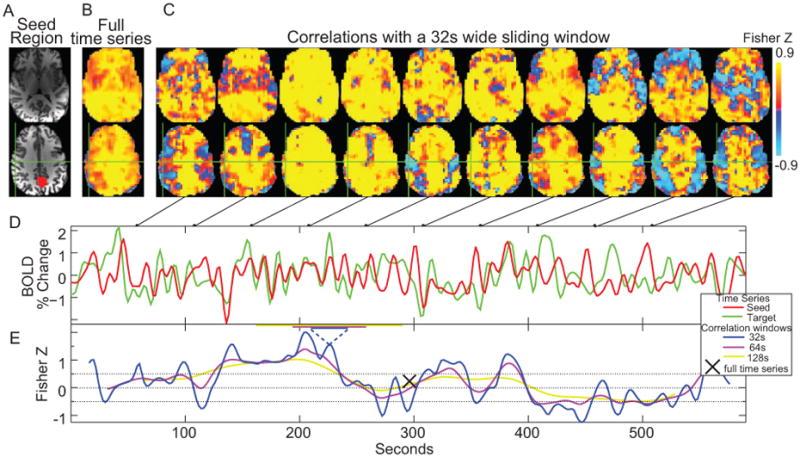
Figure 1. (A) Posterior cingulate seed (PCC) region. (B) Correlation map created from the seed using the entire 10 minute time series. (C) Correlation maps created over 32s temporal windows centered at the time points in the connected figures D and E. (D) Sample time series from the seed region (red) and a voxel at the green crosshairs (motor cortex region). (E) Correlation values over time for the sample time series using three different correlation windows with widths (32, 64, and 128 s).
In one of our first connectivity dynamics projects, we examined changes in brain correlations to the posterior cingulate cortex (PCC) across a 10-minute scan. Using that data, we showed how fMRI correlations fluctuate over time, and that these fluctuations can be periodic. While the precise frequencies of correlation fluctuations vary across subjects and runs, it is still possible to parse brain regions and combinations of brain regions based on fluctuation frequency differences. To evaluate the potential biological significance of these empirical observations, we then used synthetic time series data with identical amplitude spectra, but randomized phase to show that similar effects can still appear even if the timing relationships between voxels are randomized. This implies that observed correlation fluctuations could occur between regions with distinct amplitude spectra, whether or not there are dynamic changes in neural connectivity between such regions. As more studies of brain connectivity dynamics appear, particularly studies using correlation as a key metric, it is vital to better distinguish true neural connectivity dynamics from connectivity fluctuations that are purely related to analysis methods [Handwerker et al., 2012 NeuroImage].
2. Spatial Distribution of Most/Least Stable Functional Connections at the scale of Minutes

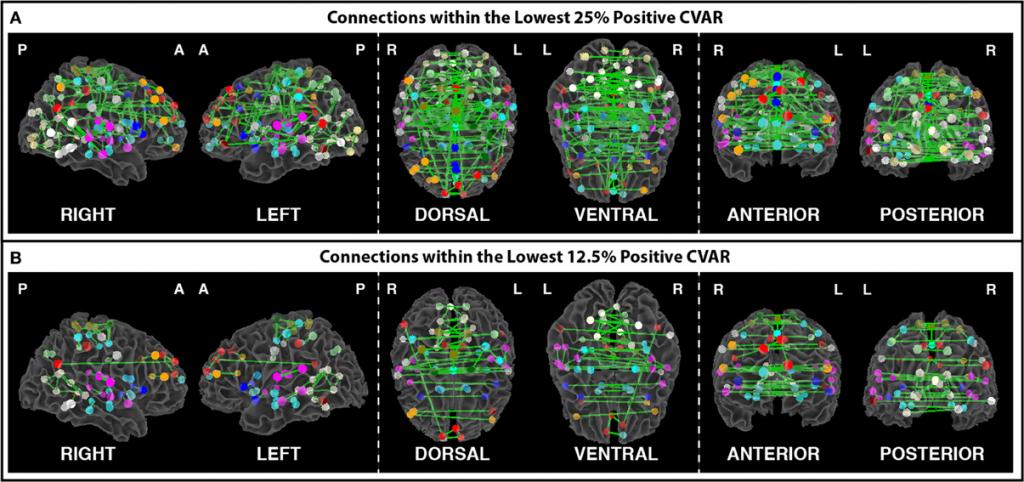
Figure 2. (A) Most stable positive connections when only connections within the lowest 25% of CVAR values are selected in each subject. (B) Most stable positive connections when only connections within the lowest 12.5% of CVAR values are selected in each subject. As the selection criterion becomes more stringent, a smaller number of connections make it to the group level maps presented here. When fewer connections are present, the symmetric inter-hemispheric pattern becomes clearer.
In this project, we attempt to characterize the temporal variability of BOLD connectivity, and understand how it is spatially distributed across the brain. For this purpose, we scanned subjects continuously for 60 minutes, at a temporal resolution of 1 second, while they rested inside the scanner. We then compute connectivity matrices between functionally-defined regions of interest for non-overlapping 1 minute windows, and classify connections according to their strength, polarity, and variability across time. We find that the most stable connections correspond primarily to inter-hemispheric connections between left/right homologous ROIs. However, only 32% of all within-network connections are classified as most stable. This shows that resting stating networks have some long-term stability, but confirms the flexible configuration of these networks, particularly those related to higher order cognitive functions. Most variable connections correspond primarily to inter-hemispheric across-network connections between non-homologous regions in occipital and frontal cortex. Using the same dataset, we also evaluate how similarity of within-subject whole-brain connectivity matrices changes as a function of window duration (used here as a proxy for scan duration). Our results suggest scanning for a minimum of 10 minutes to optimize within-subject reproducibility of connectivity patterns across the entire brain, rather than for a few predefined networks. [Gonzalez-Castillo et al. 2014, Frontiers in Neuroscience]
3. Tracking Ongoing Cognition in Individuals using Brief, Whole-Brain Functional Connectivity Patterns
Functional connectivity (FC) patterns in functional MRI exhibit dynamic behavior on the scale of seconds, with rich spatiotemporal structure and limited sets of whole-brain, quasi-stable FC configurations (FC states) recurring across time and subjects. Based on previous evidence linking various aspects of cognition to group-level, minute-to-minute FC changes in localized connections, we hypothesized that whole-brain FC states may reflect the global, orchestrated dynamics of cognitive processing on the scale of seconds. To test this hypothesis, subjects were continuously scanned as they engaged in and transitioned between mental states dictated by tasks. FC states computed within windows as short as 22.5 s permitted robust tracking of cognition in single subjects with near perfect accuracy. Accuracy dropped markedly for subjects with the lowest task performance. Spatially restricting FC information decreased accuracy at short time scales, emphasizing the distributed nature of whole-brain FC dynamics, beyond univariate magnitude changes, as valuable markers of cognition.[Gonzalez-Castillo et al. 2015, PNAS]
4. Edge time series exploration: probing fine-scale connectivity patterns and dynamics
What is the nature of a functional ‘connection’ between brain areas? Using a simple technique to temporally unwrap Pearson correlation, we can render the instantaneous similarities between two areas of the brain. These values, which form so-called 'edge time series', have the potential to reveal information about how pairs of regions fall in and out of synchrony, at the resolution of the input data. By avoiding the temporal smoothing associated with methods like sliding window analysis, edge time series approaches have the potential to capture more punctate temporal features, such as succinct moments of high or low magnitude connectivity activity. Initial explorations employing this methodology revealed the conditions of a system that potentially give rise to high-amplitude events (Faskowitz et al., OHBM 2023). Using simulated data and empirical data, we demonstrated how a network’s time-averaged clustering structure relates to the amplitude and number of events detected. Further work on edge time series has explored how edge events can be simplified and sorted, according to their temporal duration (Faskowitz et al., OHBM 2024). This approach has the potential to reveal how different regions functionally relate on different temporal scales (manuscript in preparation). Through this analysis, we can identify some areas of cortex that have functional edges with relatively long events, and some areas of cortex with predominately short connectivity traces. Edge time series analysis can reveal that not all functional connections in the brain, even those with similar Pearson correlation, take the same temporal trajectory. By better understanding the brain’s temporal patterns, we might better understand how interregional communication gives rise to behavior and cognition.
Publications:
2023
Frontiers in Human Neuroscience
2023
Cell Reports
2022
NeuroImage
2022
Royal Society Open Science
2022
NeuroImage
2021
Journal of Neuroscience
2020
Computers in Biology and Medicine
2019
NeuroImage
2018
Network Neuroscience
2018
Towards a new approach to reveal dynamical organization of the brain using topological data analysis
Nature Communications
2017
NeuroImage
2017
NeuroImage
2015
Tracking ongoing cognition in individuals using brief, whole-brain functional connectivity patterns
Proceedings of the National Academy of Sciences
2014
Frontiers in Neuroscience
Presentations:
June 2025
2025: Organization for Human Brain Mapping
June 2024
2024: Organization for Human Brain Mapping
faskowitz_ohbm24_v1.pdf
June 2024
Contribution of slow, brain-wide patterns of activity to ongoing experience in resting-state fMRI
2024: Organization for Human Brain Mapping
IGephart_OHBM2024.pdf
November 2023
2023: Society For Neuroscience
November 2023
2023: Society For Neuroscience
July 2023
2023: Organization for Human Brain Mapping
faskowitz_ohbm23_sm.pdf
July 2023
2023: Organization for Human Brain Mapping
November 2022
How conscious in-scanner throughts modulate functional connectivity during resting-state fMRI
2022: Society For Neuroscience
July 2022
November 2021
2021: Society For Neuroscience
June 2019
Contributions of covert self-driven cognition to resting stat dynamic functional connectivity
2019: Organization for Human Brain Mapping
September 2014
2014: Conference on Resting State / Brain Connectivity